Data has become one of the most valuable assets for businesses across sectors. A recent KX study(opens new window) found that 80% of companies in the UK and five other countries saw increased revenue after adopting real-time data analytics. Additionally, 98% of surveyed businesses reported that this technology improved customer satisfaction.
As more businesses experience the benefits of data-driven decision-making, the demand for advanced data solutions has soared. Tableau plays a central role in addressing this need. This popular business intelligence tool helps professionals transform raw data into actionable insights. Business leaders can use these findings to cultivate a data culture prioritising evidence-based strategies.
Mastering Tableau can improve your data analysis skills and unlock new career opportunities. This guide examines how the platform empowers businesses and professionals to make strategic decisions. We’ll also highlight practical use cases and the career benefits of learning Tableau.
What is Tableau?
Tableau(opens new window) is a powerful visual analytics platform that allows users to analyse data and convert it into accessible visualisations. Users can explore datasets in real time, detect trends, and organise information in stylish dashboards. These capabilities can reveal unexpected insights and help businesses make more informed decisions.
Tableau’s advanced features and intuitive interfaces have contributed to its global popularity. As of June 2024, the Tableau Community has over four million members(opens new window) who share advice and resources. Some users rely on Tableau to analyse data for top businesses, while others use the platform for academic research or personal projects. Regardless of your goals, Tableau has the necessary tools to manage data and visualise complex information.
Why use Tableau?
Tableau has an approximately 15% market share(opens new window) in the fiercely competitive data analytics space. It offers several advantages that make it a preferred choice for many business users and upskillers aiming to build their analytical abilities.
First, Tableau has an intuitive drag and drop interface to streamline the design process. This convenient feature allows users of all skill levels to build sophisticated visualisations without prior programming knowledge. For example, you can create a complex chart by dragging data fields into rows and columns. To rearrange the visualisations, simply drag and drop the elements to new locations.
Additionally, Tableau allows users to build customised and interactive dashboards. These displays showcase multiple visualisations in a centralised location. Viewers can interact with the data by clicking individual charts and graphs, applying filters, and adjusting date ranges. These features increase engagement by allowing the audience to explore datasets and trends.
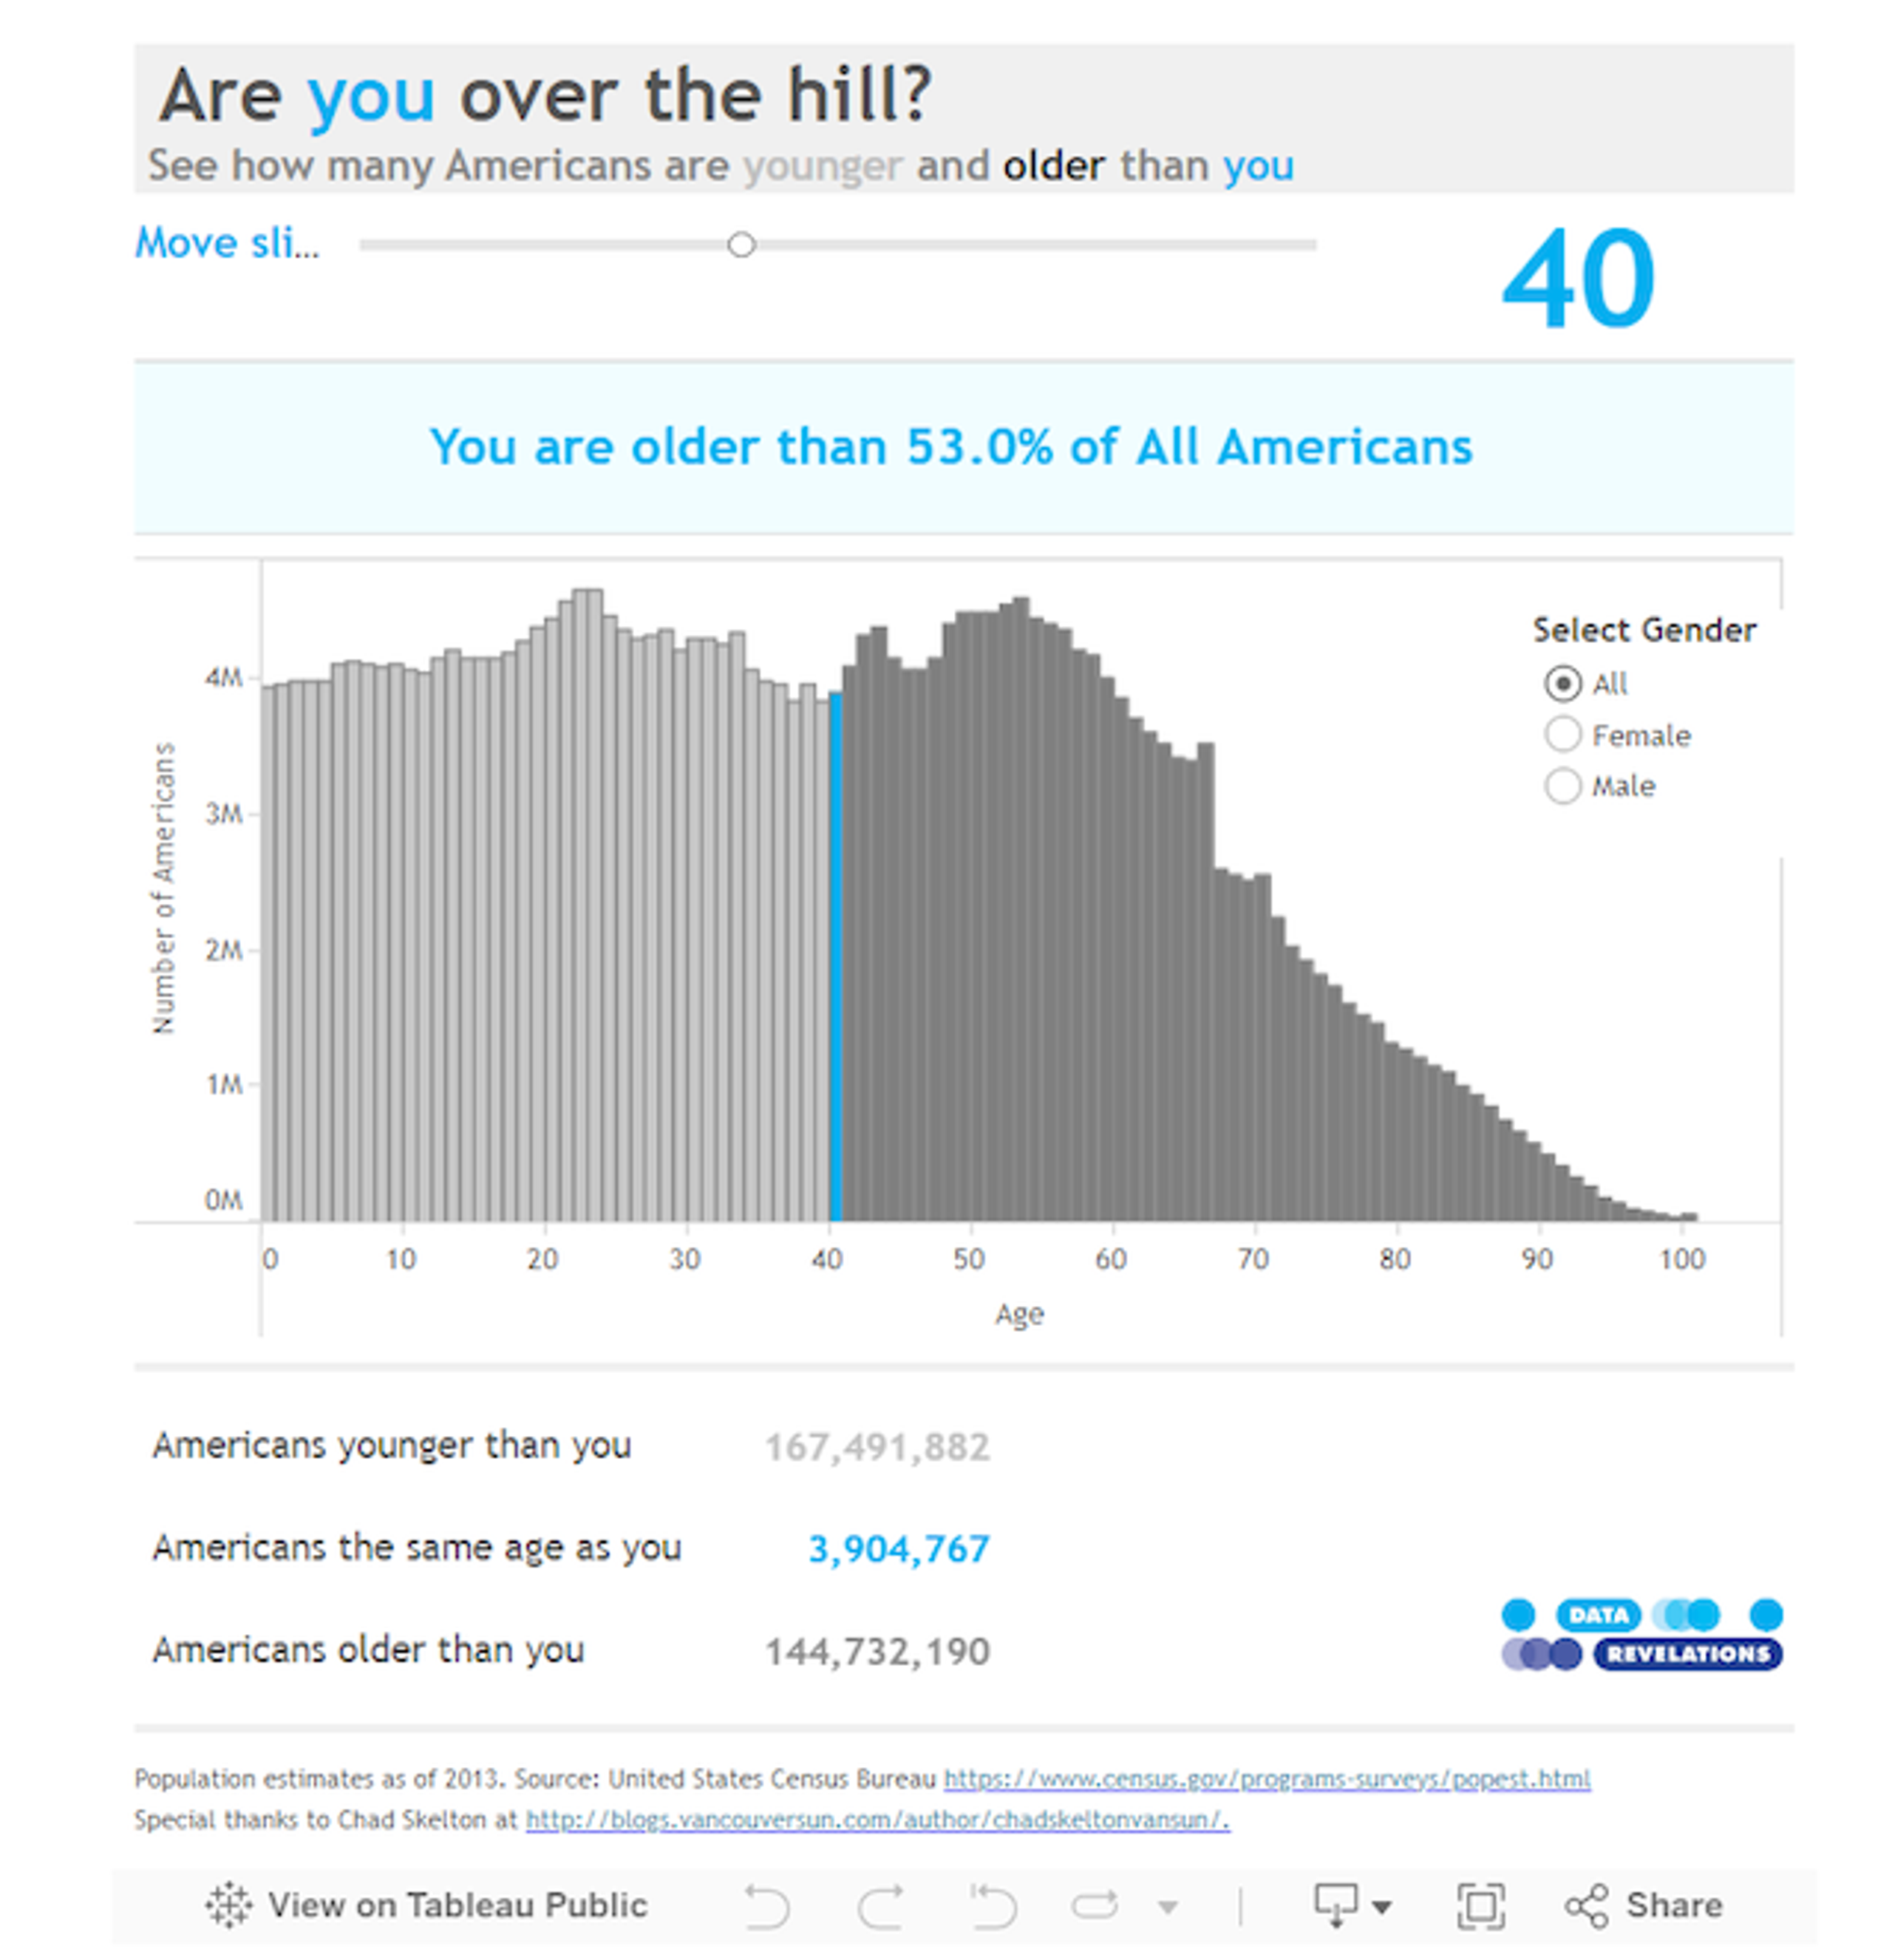
Explore the interactive version on Tableau Public.
For example, Steven Wexler used data from the United States Census Bureau to create a Tableau dashboard titled “Are you over the hill?” Users can adjust a slider to select their age and view how many Americans are younger and older than them. They can also filter the chart by gender for more tailored insights into the country’s age distribution. This playful dashboard personalised demographic trends by making it relevant to the audience’s life stages.
Tableau also offers real-time data analysis and reporting. Users can build data pipelines that collect information from multiple data sources. For example, you might gather data from Google Cloud and your website. Tableau’s powerful engine organises this information into a structured database, visually maps it, and extracts meaningful insights. Additionally, Tableau enables users to create reports automatically and share their findings quickly.
Top applications of Tableau
Tableau is a highly versatile data analytics platform with many practical applications. Here are three ways this tool can provide insights and help businesses develop a data driven culture.
Data visualisation for business intelligence
Business Analysts frequently need to process and understand large datasets containing confidential information. For example, they might analyse thousands of financial transactions to detect fraud.
Tableau simplifies this complex data and extracts actionable visual insights. For instance, Business Analysts might use Tableau and R to mine data from financial records and detect irregularities. They can also create customised dashboards to compare historical trends and benchmark performance.
A data driven organisation can use Tableau to make strategic choices rapidly and seize emerging opportunities. Businesses can also use this business intelligence tool to respond to crises promptly and calculate risk.
Usage across industries
People often assume that only finance and tech companies use Tableau, but that’s not true. Many industries adopt this tool for efficient data analysis and management.
Healthcare organisations use Tableau to analyse and visualise patient data and operational metrics. These applications enable them to improve both patient care and operational efficiency. For example, Guy’s and St Thomas’ Charity(opens new window) uses Tableau to interpret geographic and patient data. The platform provides valuable insights into the relationships between demographics, places, and health issues. The organisation uses these findings to help address childhood obesity and other prevalent health disorders in the UK.
Additionally, Tableau’s data analytics capabilities allow retailers to gain critical insights about customer and employee behaviour. For instance, Tesco’s Customer Engagement Centre(opens new window) uses Tableau to analyse employee productivity and proactively monitor training needs. The platform also enables the grocery chain to analyse handwritten feedback from training course attendees and identify areas for improvement.
Mobile capabilities and collaboration features
Tableau offers many collaboration tools to promote accessibility and teamwork. For example, Tableau Server and Tableau Cloud allow teams to share data and collaborate in a centralised workbook. You can also create automated subscriptions to send regular updates to your team.
Work on your visual analytics projects from any location with Tableau Mobile. This mobile application lets you explore data from your tablet or phone, even without an internet connection. Automated authentication and other cybersecurity features protect sensitive data while you use the app.
Getting started with Tableau
Tableau makes it easy to start building and exploring data visualisations. This tool integrates seamlessly with many data platforms, including:
- Cloud-based systems like AWS and Dropbox
- Customer relationship management tools, such as HubSpot and Salesforce
- Spreadsheets from Microsoft Excel and Google Sheets
- SQL databases
These integrations allow you to import existing data into Tableau and start analysing it in minutes.
Tableau also has unique data blending capabilities, enabling you to combine information from different sources for more in-depth analyses. You’ll connect Tableau to two or more data sources, define their relationships to each other, and extract insights. The platform presents the results from each source in the same visualisation, so you can quickly compare the data.
Advanced features in Tableau
As you gain confidence and experience with Tableau, expand your skills by trying these sophisticated features.
Predictive analytics and AI integration
Advanced Tableau users can leverage artificial intelligence and predictive analytics tools. For example, the AI-powered Tableau Agent uses natural language processing to perform complex calculations and suggest ways to explore data. The platform also uses linear regression to develop predictive models based on existing data. These features provide deeper insights and accelerate the data journey.
Tableau extensions
While Tableau offers a broad range of features, you’re not limited to its built-in functionalities. Third party partners provide additional tools to extend the platform’s capabilities and develop industry-specific solutions. For instance, Synchronised Refresh enables real-time collaboration by refreshing shared dashboards for all users, while EasyDesigns lets you customise your dashboards with dynamic imagery.
How to use Tableau for your career growth
At first glance, Tableau might seem like a niche tool, especially if your current role doesn’t involve data visualisation. However, employers increasingly seek job candidates who can use Tableau to tell engaging stories about data.
Analytics ranks sixth on LinkedIn’s 2024 Most In-Demand Skills List(opens new window), and the job board lists over 2,000 job openings in the UK requiring Tableau expertise. These statistics highlight the tool’s growing importance in the job market. However, the Multiverse Skills Intelligence Report found that 55% of workers lack familiarity with PowerBI and Tableau skills, leading to a critical skills gap.
You can help meet this demand by learning how to use data analytics tools effectively. Luckily, there are plenty of resources to help you master Tableau and pursue new career opportunities.
Careers that use Tableau
Professionals across industries rely on visual analytics to guide decision making and drive success. Here are two roles that frequently use Tableau and other modern business intelligence tools.
Data scientist
A data scientist uses advanced programming techniques and statistical methods to gain insights from data. They use these findings to help business leaders answer questions and make informed decisions.
The typical responsibilities for data science roles include:
- Gathering information from private and published data sources, such as employee attendance records and housing data
- Cleaning raw data and organising it into a usable format
- Analysing data to detect patterns, trends, and anomalies
- Training machine learning algorithms to interpret big data and build predictive models
- Creating visualisations with Tableau and other self service analytics tools
- Developing accessible and clear reports
According to Glassdoor, Data Scientists earn an average salary of £48,362 in the UK. However, pay can vary significantly by region. For example, Data Scientists in London earn £60,164 annually on average, though this elevated salary typically reflects the city’s higher cost of living.
Data analyst
A Data Analyst collects and analyses information from various data sources, from Google Analytics to tax records. Like Data Scientists, they use the insights they gain to address business problems and support decision-making processes. However, these professionals typically don’t use advanced data analysis methods like predictive modelling.
Here are a few tasks often performed by Data Analysts:
- Finding appropriate data sources
- Collaborating with Business Analysts, Data Architects, and other experts to build data pipelines
- Preprocessing and structuring data
- Using statistical methods and software to interpret data
- Visualising data with Tableau
- Communicating insights to non technical users
Glassdoor reports that Data Analysts in the U.K. earn £34,187 per year on average. In London, the average salary for Data Analysts is £41,211.
Skills development in data visualisation
Strengthening your data analytics skills can boost your career prospects and help you transition into new analytics-related roles.
Start by developing Tableau proficiency. Visit the website(opens new window) to start your free trial of Tableau desktop. This offer lets you spend 14 days exploring the capabilities and applications of the visualisation tool.
Once you’ve exhausted your free trial, the platform offers several affordable pricing options for individuals. For instance, Tableau Viewer gives you access to published dashboards and visualisations designed by other Tableau users. However, you can’t create or modify dashboards.
By contrast, Tableau Explorer and Tableau Creator let you build and manage new dashboards. Tableau Creator has more functionalities, so it works best for upskillers seeking hands-on experience with the platform. More advanced packages like Tableau Server are designed for enterprises and require at least one Creator licence to deploy data visualisations. Consider asking your current employer to provide access if you want the most comprehensive features.
Other in-demand data visualisation skills include:
- Data storytelling: Use data to tell engaging and persuasive narratives
- Programming proficiency: Data professionals often use Python and R to interpret data
- SQL: A programming language used for data management and processing
Learning resources and certificates
Tableau might seem daunting at first, but the platform offers a wealth of free resources to help beginners master the basics. You can watch the free introductory video sequence(opens new window), explore Tableau Starter Kits(opens new window), and ask questions in the Tableau Community.
While these self-learning resources provide foundational Tableau knowledge, many people prefer the guidance of a structured curriculum. Multiverse’s upskilling programme allows professionals to study advanced data science concepts, such as data management, data visualisation, and natural language processing.
Upskillers learn to analyse data with Tableau, traditional BI tools, and programming languages. They also gain hands-on experience by completing real projects for employers and develop a diverse portfolio.
Master data science tools
Tableau is one of the most powerful data discovery tools. This platform allows businesses to analyse almost any data, from Instagram comments to sales metrics. Organisations can use the insights they gain from this platform to gain a competitive edge and develop out-of-the-box solutions.
As more businesses embrace data driven decision making, the demand for Tableau skills will continue to grow. Expand your data science knowledge with Multiverse’s upskilling program. You’ll position yourself for new opportunities by building future-proof skills like advanced analytics, data visualisation, and machine learning. Our upskillers also gain practical experience and receive individual career mentorship.
Take the next step on your exciting data journey by completing our quick application(opens new window).
